Vest
A Swift iOS stock trading concept for tracking watchlists, searching stocks, viewing portfolio performance, and managing investments.

Vest
Track stocks, manage your portfolio, and discover new investments.
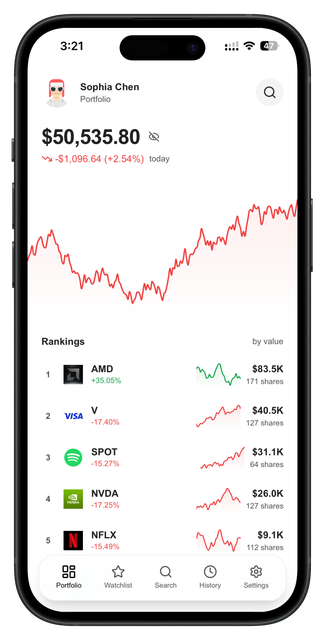
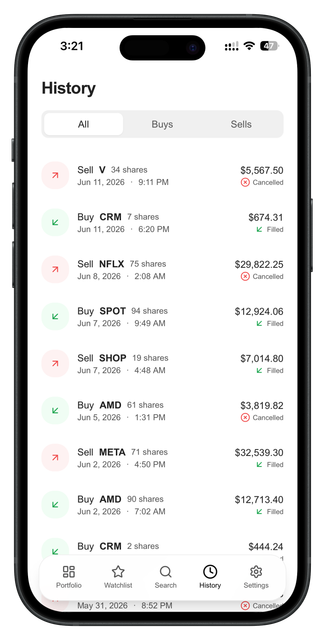
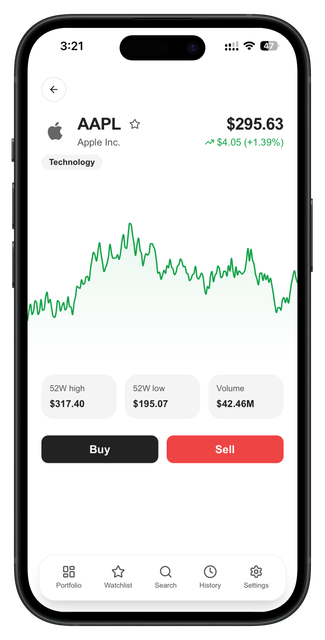
Vest is a stock trading concept designed for clear portfolio tracking and quick market discovery. The app gives users a watchlist for following stocks, a search screen to find new tickers, detailed stock pages with charts and stats, and a portfolio view that shows balance, holdings, and performance at a glance.
The idea was to create a trading interface that stays clean and readable even when financial data gets detailed. Most trading apps crowd the screen with numbers, labels, and tiny buttons. Vest keeps the layout simple: cards for stock summaries, clear green and red indicators for movement, bottom sheets for detail, and a dashboard that always shows the most important number first.
The user starts on a dashboard with their portfolio balance, key holdings, and quick access to their watchlist. They can search for stocks by name or ticker, view a detailed stock page with chart, stats, and news, add stocks to their watchlist, and check their full portfolio performance over different time periods.
The design uses a clean financial palette: dark surfaces for the main dashboard, green for gains and positive indicators, red for losses and negative movement, light grey for cards and dividers, and white for text and important data. The colors follow market conventions so the user can read performance immediately.
This concept was planned for Swift and SwiftUI using portfolio cards, watchlist rows, search with autocomplete, stock detail sheets, interactive chart components, holding summaries, and time period selectors. The design took around 3–4 days.
The flow is designed for quick decisions: check your dashboard, browse your watchlist, search for new stocks, and review detailed performance.
Product thinking
Problem
Stock trading apps can feel overwhelming when financial data, charts, watchlists, and portfolio details compete for space on a small screen.
Solution
The solution is a clean card-based layout that separates watchlist, search, portfolio, and stock detail into focused, readable sections.
Target user
Investors who want to track stocks, manage a portfolio, search for new tickers, and monitor performance on mobile.
Key features
User flow diagram
Dashboard
View portfolio balance and top holdings.
Watchlist
Follow stocks and track price movement.
Search
Find tickers and view stock details.
Detail
Review charts, stats, and performance.
App structure
Design summary
Dashboard portfolio, watchlist, search, stock detail.
Card-based stock summaries, green and red movement indicators, interactive charts, and fast ticker search.
Clean, confident, professional, data-driven, modern, and readable.